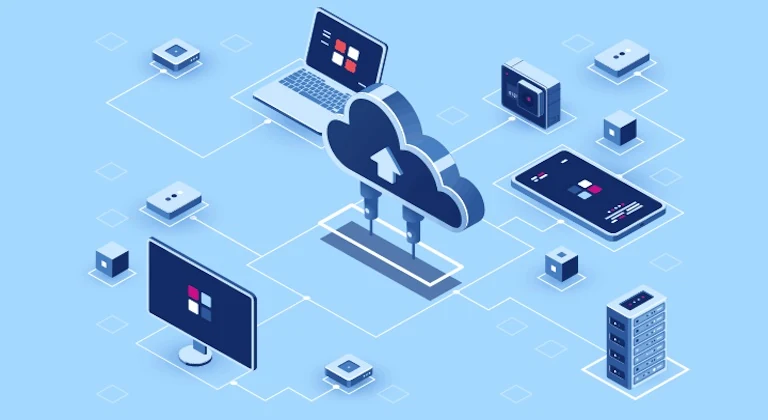
Data analytics in the cloud gives businesses a practical way to store, process, govern, and analyze large datasets without building every part of the platform themselves. Instead of buying enough servers for peak demand, teams can use cloud storage, managed databases, streaming services, data warehouses, lakehouses, machine learning tools, and visualization platforms as business needs change.
The value is not just cheaper storage or faster dashboards. A well-designed cloud analytics platform helps teams turn raw data into useful decisions: which customers are at risk, which products are underperforming, which systems are slowing down, where costs are rising, and which actions should happen next. That matters for ecommerce, finance, healthcare, manufacturing, SaaS, logistics, media, education, and almost every modern business that depends on digital activity.
This guide explains how cloud data analytics works, how big data pipelines are structured, which workloads fit cloud platforms, where costs can get out of control, and what security and governance controls should be planned from the start. If you are still comparing the broader infrastructure side, you may also want to read our guides on cloud computing, choosing a cloud service provider, and hybrid cloud architecture.
What Is Cloud Data Analytics?
Cloud data analytics is the practice of collecting, storing, transforming, analyzing, and visualizing data using cloud-based infrastructure and managed services. The data may come from websites, mobile apps, business software, CRM systems, payment systems, IoT devices, logs, call centers, databases, spreadsheets, or third-party feeds.
A typical analytics platform has several layers. The ingestion layer captures data. The storage layer keeps raw and processed records. The processing layer cleans, joins, and models the data. The governance layer controls quality, privacy, access, lineage, and retention. The consumption layer exposes dashboards, reports, APIs, machine learning features, alerts, and business workflows.
Why Cloud Works So Well for Big Data
Big data has three practical challenges: volume, speed, and variety. Data volumes grow quickly. Some data arrives in real time. Formats vary across logs, transactions, documents, events, images, sensor feeds, and third-party datasets. Traditional on-premises systems can handle some of this, but they often struggle when storage and compute demand changes sharply.
Cloud platforms separate storage from compute, which gives teams more flexibility. A business can store large volumes of raw data economically, then scale processing only when jobs run. Analytics teams can launch temporary compute for heavy transformations, dashboards can query a warehouse, machine learning teams can train models, and finance teams can monitor usage without buying fixed hardware for every scenario.
The result is speed and optionality. Teams can test new datasets, build prototypes, create temporary environments, and scale successful workloads without waiting through long procurement cycles. That same flexibility requires discipline, because poorly governed analytics platforms can become expensive and confusing fast.
Core Architecture Options
There is no single correct architecture for every company. A small business may need a managed warehouse and a dashboard tool. A SaaS company may need event streaming, product analytics, and near real-time alerts. A manufacturer may combine factory sensor data with ERP and supply chain records. The right design depends on latency, data volume, compliance, team skills, and business goals.
| Architecture pattern | Best for | Strengths | Watch out for |
|---|---|---|---|
| Cloud data warehouse | Reporting, dashboards, finance analysis, sales analytics, executive metrics. | Fast SQL analytics, structured data, business intelligence integration, strong governance options. | Can become costly if queries are inefficient or if raw unmodeled data is loaded without discipline. |
| Data lake | Large raw datasets, logs, clickstream data, IoT feeds, historical archives, data science exploration. | Flexible storage for structured and unstructured data with lower-cost retention. | Without cataloging and quality controls, it can become a dumping ground that nobody trusts. |
| Lakehouse | Teams that want data lake flexibility with warehouse-like governance and analytics. | Supports raw data, curated datasets, machine learning, and BI from a shared foundation. | Requires clear table standards, access rules, and data lifecycle management. |
| Streaming analytics | Fraud detection, live operations, IoT monitoring, personalization, alerting, event-driven workflows. | Analyzes events as they arrive, reducing delay between signal and action. | Operational complexity is higher, and teams must design for ordering, retries, and late-arriving data. |
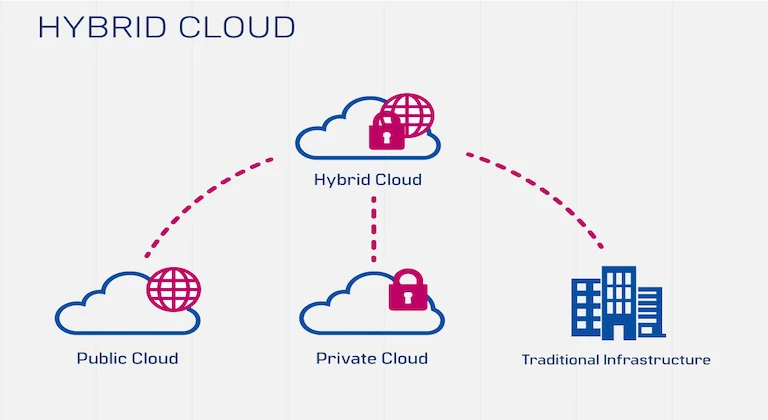
| Hybrid analytics | Regulated industries, legacy systems, private databases, and phased cloud migration. | Keeps sensitive or latency-critical systems controlled while using cloud services for scale. | Requires strong identity, networking, and data movement governance across environments. |
Types of Analytics Businesses Can Run in the Cloud
Cloud analytics can support different levels of decision-making. The most useful platforms usually grow from descriptive reporting into predictive and prescriptive workflows as data quality improves.
| Analytics type | Main question | Common cloud tools | Business example |
|---|---|---|---|
| Descriptive analytics | What happened? | Data warehouse, dashboards, scheduled reports, metric layers. | Monthly revenue, support volume, website traffic, inventory movement. |
| Diagnostic analytics | Why did it happen? | Drill-down reports, log analytics, cohort analysis, anomaly detection. | Explaining a conversion drop, failed delivery spike, or service slowdown. |
| Predictive analytics | What is likely to happen? | Machine learning pipelines, forecasting models, feature stores, model monitoring. | Churn prediction, demand forecasting, fraud risk, maintenance prediction. |
| Prescriptive analytics | What should we do next? | Optimization models, recommendation systems, automated alerts, decision APIs. | Next-best offer, route optimization, inventory replenishment, pricing actions. |
Batch, Real-Time, and Streaming: Choosing the Right Processing Speed
Not every dataset needs real-time processing. Many reports work well with hourly or daily refreshes. Some use cases need minute-level updates. A smaller group truly needs streaming analysis within seconds. Choosing the right processing speed is one of the easiest ways to avoid unnecessary cost and complexity.
Business Benefits of Cloud-Based Data Analytics
1. Faster time to insight
Cloud services shorten the path from data source to dashboard. Teams can use managed ingestion, scalable storage, query engines, and visualization tools rather than building every component from scratch. This helps analysts answer business questions faster and reduces the backlog of one-off reporting requests.
2. Scalable storage and processing
Big data workloads do not grow evenly. A retail company may process more data during holiday campaigns. A SaaS platform may collect more events after a product launch. A logistics company may need heavy optimization runs during disruptions. Cloud infrastructure can scale with these changes and then scale back down.
3. Better collaboration between teams
Centralized cloud data platforms help engineering, analytics, finance, product, and leadership work from consistent datasets. When definitions are governed, teams spend less time arguing over which number is correct and more time improving the business.
4. Easier access to machine learning and AI
Cloud platforms often provide managed services for model training, feature management, vector search, natural language processing, and automated workflows. That makes it easier to connect analytics with AI in cloud computing, as long as data quality and governance are strong enough to support it.
5. Lower barrier to experimentation
Teams can test a new dataset, prototype a model, or build a temporary analytics environment without buying permanent hardware. This helps businesses learn faster, but it also requires budgets, tagging, and cleanup rules so experiments do not become permanent waste.
Security, Privacy, and Governance
Data analytics platforms concentrate valuable information in one place. That makes governance essential. Security should not be added after dashboards are already live. It should be part of the platform design from the beginning.
At minimum, teams should classify sensitive data, restrict access by role, encrypt data in transit and at rest, log administrative actions, mask or tokenize protected fields, define retention rules, and review permissions regularly. Data quality should also be managed through tests, ownership, lineage, and documentation. A dashboard built on untrusted data can create confident but wrong decisions.
If the organization is still building its cloud security baseline, start with the controls in our cloud security best practices guide. Analytics adds extra risk because the platform may combine customer data, financial data, operational logs, and employee access in one environment.
Cost Control: Where Cloud Analytics Gets Expensive
Cloud analytics can be cost-efficient, but the bill can rise quickly when data is duplicated, queries scan too much storage, streaming jobs run without limits, development environments are left active, or teams keep every log forever. Cost governance should be designed into the platform, not treated as a monthly surprise.
Good cost controls include workload tagging, storage lifecycle policies, query optimization, budget alerts, reserved capacity for predictable usage, separate environments for development and production, and regular reviews of unused tables, dashboards, jobs, and data exports.
Implementation Roadmap
A cloud analytics project should start with business questions, not tools. The platform should be designed around decisions the organization needs to make and the data needed to support those decisions.
- Define decision goals. List the questions the business needs answered, who owns them, and how frequently answers are needed.
- Inventory data sources. Map databases, SaaS tools, event streams, files, logs, IoT devices, spreadsheets, and third-party feeds.
- Classify data sensitivity. Identify personal data, payment data, health data, financial records, confidential operations data, and regulated fields.
- Choose the architecture pattern. Decide whether the first version needs a warehouse, lake, lakehouse, streaming layer, or hybrid approach.
- Build ingestion and transformation standards. Use clear naming, schema management, validation tests, and repeatable jobs.
- Create trusted datasets. Curate business-ready tables for revenue, customers, products, operations, marketing, and support.
- Publish dashboards and alerts. Prioritize high-value workflows instead of producing many unused reports.
- Monitor quality, cost, and usage. Track freshness, failures, query cost, user adoption, and stale assets.
When to Use Serverless or Cloud-Native Analytics
Some analytics workloads run only when data arrives or when a scheduled job starts. These are good candidates for event-driven and serverless patterns. A file upload can trigger a transformation job. A stream event can trigger an alert. A scheduled workflow can refresh a dashboard. This can reduce operational overhead when workloads are intermittent.
For application teams, analytics also connects naturally to cloud-native applications. Product events, user behavior, API logs, and performance metrics can flow directly into analytics pipelines. For intermittent data jobs, our guide to serverless computing explains why pay-per-use execution can fit variable workloads, though it still needs monitoring and cost limits.
Common Mistakes to Avoid
Mistake one: collecting data without ownership. Every important dataset should have an owner responsible for definition, quality, access, and documentation.
Mistake two: moving every report without improving definitions. A messy dashboard does not become useful just because it runs in the cloud. Migration is a chance to standardize metrics and remove duplicate reports.
Mistake three: ignoring data quality tests. Broken pipelines, missing fields, duplicate records, and delayed updates can silently damage business decisions.
Mistake four: giving broad access by default. Analysts need useful access, but sensitive data should be protected through roles, masking, approvals, and audit logs.
Mistake five: choosing tools before use cases. The best platform is the one that answers important questions reliably. Tool selection should follow business requirements, team skills, security needs, and cost model.
FAQ
Is cloud analytics only for large companies?
No. Small businesses can start with a managed warehouse, a few key data sources, and a dashboard tool. The important step is to start with business questions and add complexity only when it creates value.
What is the difference between a data warehouse and a data lake?
A data warehouse is optimized for structured analytics and business reporting. A data lake stores raw or semi-structured data more flexibly. Many modern platforms combine both ideas through a lakehouse pattern.
Does cloud analytics require real-time data?
No. Real-time analytics is useful for fraud, operations, personalization, and monitoring, but many business decisions work well with hourly or daily refreshes. The processing speed should match the decision window.
How do businesses keep analytics data secure?
They classify sensitive data, limit access by role, encrypt data, monitor activity, mask protected fields, test data quality, and define retention policies. Governance is as important as the analytics tool itself.
Conclusion
Data analytics in the cloud can help businesses move from scattered reports to trusted, scalable, decision-ready information. The strongest platforms combine flexible storage, reliable ingestion, governed transformation, cost controls, and clear ownership. They also connect analytics to real business action through dashboards, alerts, APIs, and machine learning workflows.
The best cloud analytics strategy is not the most complex one. It is the one that answers valuable questions, protects sensitive data, keeps costs visible, and gives teams confidence in the numbers they use every day.