The basic margin formula in Excel is =(Revenue-Cost)/Revenue. It measures how much of each sales dollar remains after cost. If revenue is 100 and cost is 60, profit is 40 and margin is 40 percent. The formula is simple, but it is also easy to confuse with markup. Margin divides profit by revenue. Markup divides profit by cost. Those two percentages are not the same, and mixing them can create serious pricing mistakes.
Use margin when you want to understand the share of sales kept as profit. Use markup when you want to understand how much price is added on top of cost. Most sales reports, product dashboards, and management summaries use margin because it connects profit back to revenue. In Excel, the cleanest worksheet layout is to keep revenue in one column, cost in the next column, profit in a helper column, and margin percentage in the final column.
Build the basic margin sheet
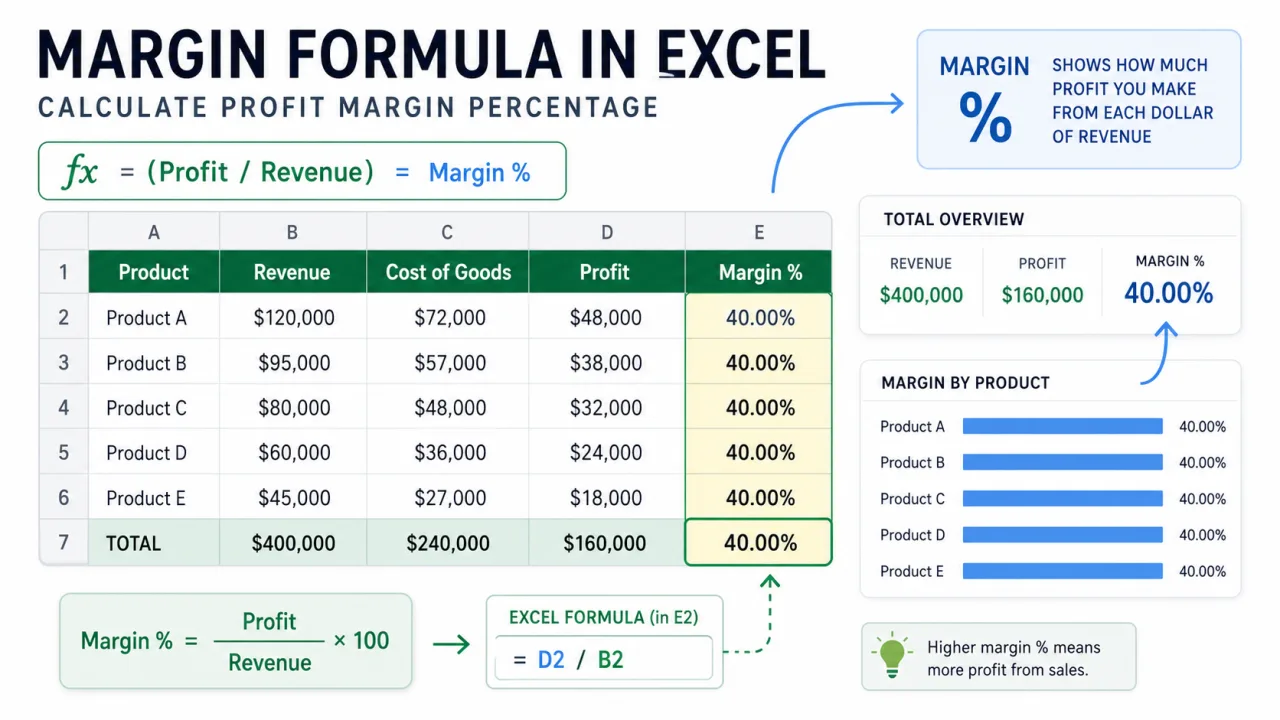
Put revenue in B2 and cost in C2. In D2, calculate profit with =B2-C2. In E2, calculate margin with =D2/B2. You can also calculate margin directly with =(B2-C2)/B2. Both formulas return the same result. The helper profit column is easier to audit because anyone reviewing the sheet can see the dollar profit and the margin percentage side by side.
After entering the formula, format the margin cell as Percentage. A raw result of 0.38 becomes 38%. Do not multiply by 100 inside the formula if you plan to use percentage formatting. =D2/B2 formatted as Percentage is cleaner than =(D2/B2)*100 formatted as Number. Keeping the result as a true percentage also makes charts, conditional formatting, and summaries easier to manage.
Handle zero revenue safely
If revenue can be zero, the margin formula can return a divide by zero error. Use =IF(B2=0,"",D2/B2) to leave the margin blank when there is no revenue. If you prefer to show zero, use =IF(B2=0,0,D2/B2). A blank is usually safer because a zero margin and no revenue are different business situations.
Negative revenue or negative cost needs a business decision before it needs a formula. Returns, refunds, rebates, and credits can make a raw margin percentage look strange. For example, a returned sale may show negative revenue and negative cost. That may be valid accounting data, but it should usually be analyzed separately from normal sales. If the workbook mixes normal sales and returns in the same margin column, add a transaction type field so the report can be filtered cleanly.
| Metric | Formula | Meaning |
|---|---|---|
| Profit | =Revenue-Cost | Dollar amount kept after cost. |
| Margin | =Profit/Revenue | Percent of sales kept as profit. |
| Markup | =Profit/Cost | Percent added above cost. |
| Safe margin | =IF(B2=0,"",D2/B2) | Avoids divide by zero errors when revenue is missing or zero. |
Margin versus markup
Margin and markup are often confused because both use profit. The denominator is different. Margin uses revenue. Markup uses cost. If an item costs 60 and sells for 100, profit is 40. Margin is 40/100, which is 40 percent. Markup is 40/60, which is 66.7 percent. If someone says "we need 40 percent margin" and another person prices using 40 percent markup, the selling price will be too low.
Calculate weighted margin for a group
Do not average row margins when you need the margin for a group. Average margin can be misleading because small sales and large sales receive the same weight. The safer group margin is total profit divided by total revenue. If revenue is in B2:B20 and cost is in C2:C20, use =(SUM(B2:B20)-SUM(C2:C20))/SUM(B2:B20). If you already have profit in D2:D20, use =SUM(D2:D20)/SUM(B2:B20).
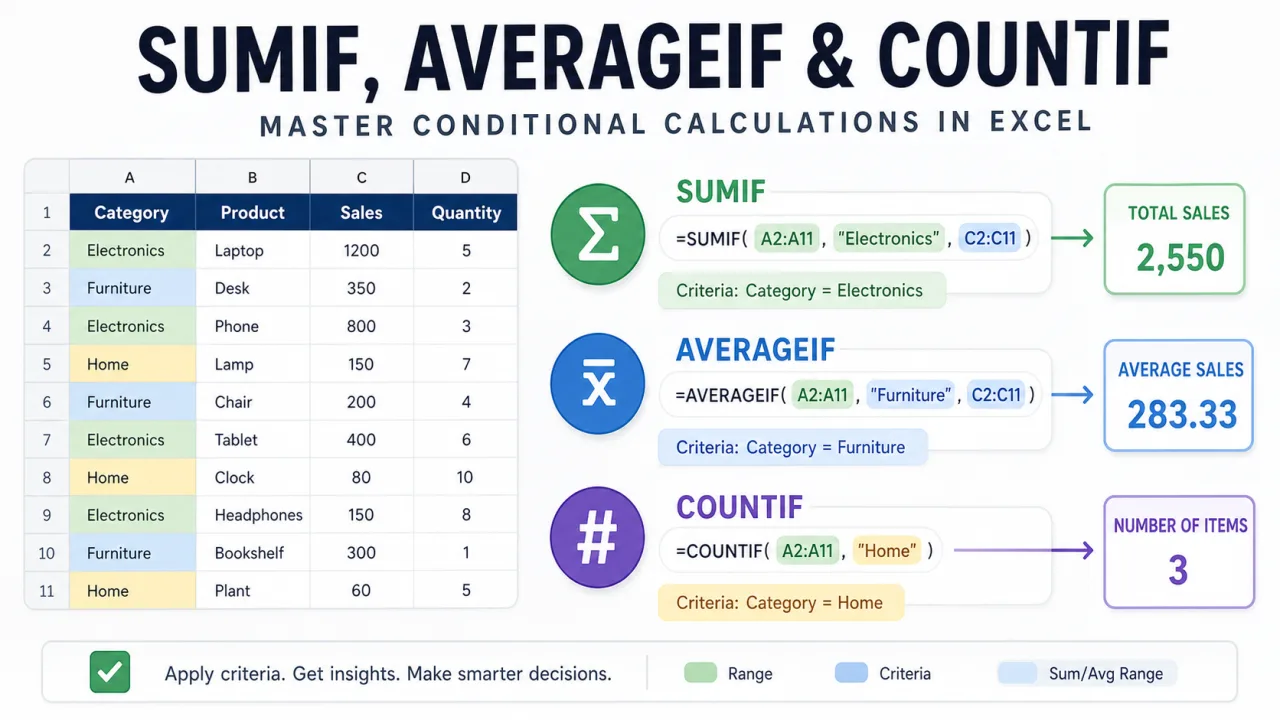
This matters in product reports. A small product with 80 percent margin and 100 dollars of revenue should not have the same influence as a large product with 35 percent margin and 50,000 dollars of revenue. Weighted margin reflects the money behind the percentage. If you need to summarize revenue or cost by category before calculating margin, the techniques in SUMIF AVERAGEIF and COUNTIF formula usage fit naturally before the margin step.
Use margin formulas in dashboards
For a dashboard, keep the raw margin formula in the data table and create summary cards from totals. A product card can show total revenue, total cost, total profit, and weighted margin. A region card can do the same. Conditional formatting can highlight low margin rows, but choose thresholds carefully. A 20 percent margin may be excellent in one product category and poor in another. The best threshold is usually based on the business model, not a random color scale.
When charting margin, avoid mixing dollar bars and margin percentages on the same axis. Use a separate percentage chart or a secondary axis only when it is clearly labeled. A clean margin chart should make the percentage trend easy to read without hiding the revenue size behind it. If revenue size matters, show revenue and margin in separate visuals or add revenue as a label.
Audit margin formulas before sharing
Check three things before sending a margin workbook. First, confirm that revenue is positive and cost is in the correct column. Second, confirm that the margin formula divides by revenue, not cost. Third, confirm that the summary margin is weighted. If the workbook is used for pricing decisions, add a small note near the formula explaining whether the percentage is margin or markup. That one label can prevent a costly misunderstanding.
A good margin worksheet does not need to be complicated. It needs clean inputs, visible profit, a clear percentage formula, and a summary that respects the size of each sale. Once those parts are in place, the workbook can support pricing, product review, monthly reporting, and category analysis without hiding the calculation behind unclear numbers.